

Data Analysis & Interpretation
By Watson Quest – Test Approved Center
Data analysis and interpretation is the process of examining, cleaning, transforming, and modeling data to extract meaningful insights, support decision-making, and evaluate performance in organizational or research settings. At Watson Quest, this process is applied in HR assessments, psychometric testing, operational evaluation, and industry-specific analytics to ensure that organizations make evidence-based decisions.
Data analysis goes beyond numbers; it provides patterns, trends, and actionable conclusions that drive efficiency, productivity, and strategic planning.
1. Stages of Data Analysis


a) Data Collection
The first step involves gathering relevant data from various sources such as:
- Surveys & assessments (psychometric, HR, customer feedback)
- Operational records (sales, logistics, production)
- Financial data (revenue, expenses, KPIs)
- Research datasets (academic, clinical, or market data)
b) Data Cleaning
Raw data often contains errors, missing values, or duplicates, which can affect accuracy.
Tasks include:
- Removing duplicates
- Handling missing or inconsistent values
- Standardizing data formats
c) Data Transformation
Data is converted into a structured format suitable for analysis:
- Categorizing qualitative data
- Aggregating numerical data
- Normalizing values
- Creating variables for analysis
2. Data Analysis Techniques
Watson Quest employs a combination of quantitative, qualitative, and AI-powered analytics to extract insights.
a) Descriptive Analysis
Summarizes data to understand trends, averages, and patterns.
- Mean, median, mode
- Frequency counts
- Percentages and distributions
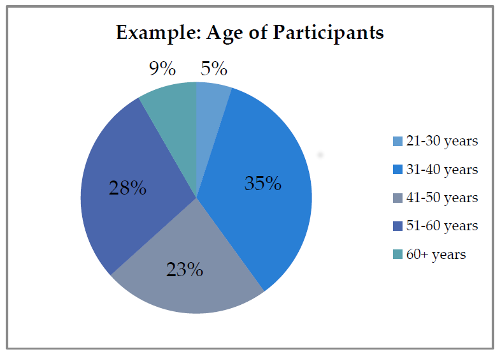
- Data visualization with charts and graphs
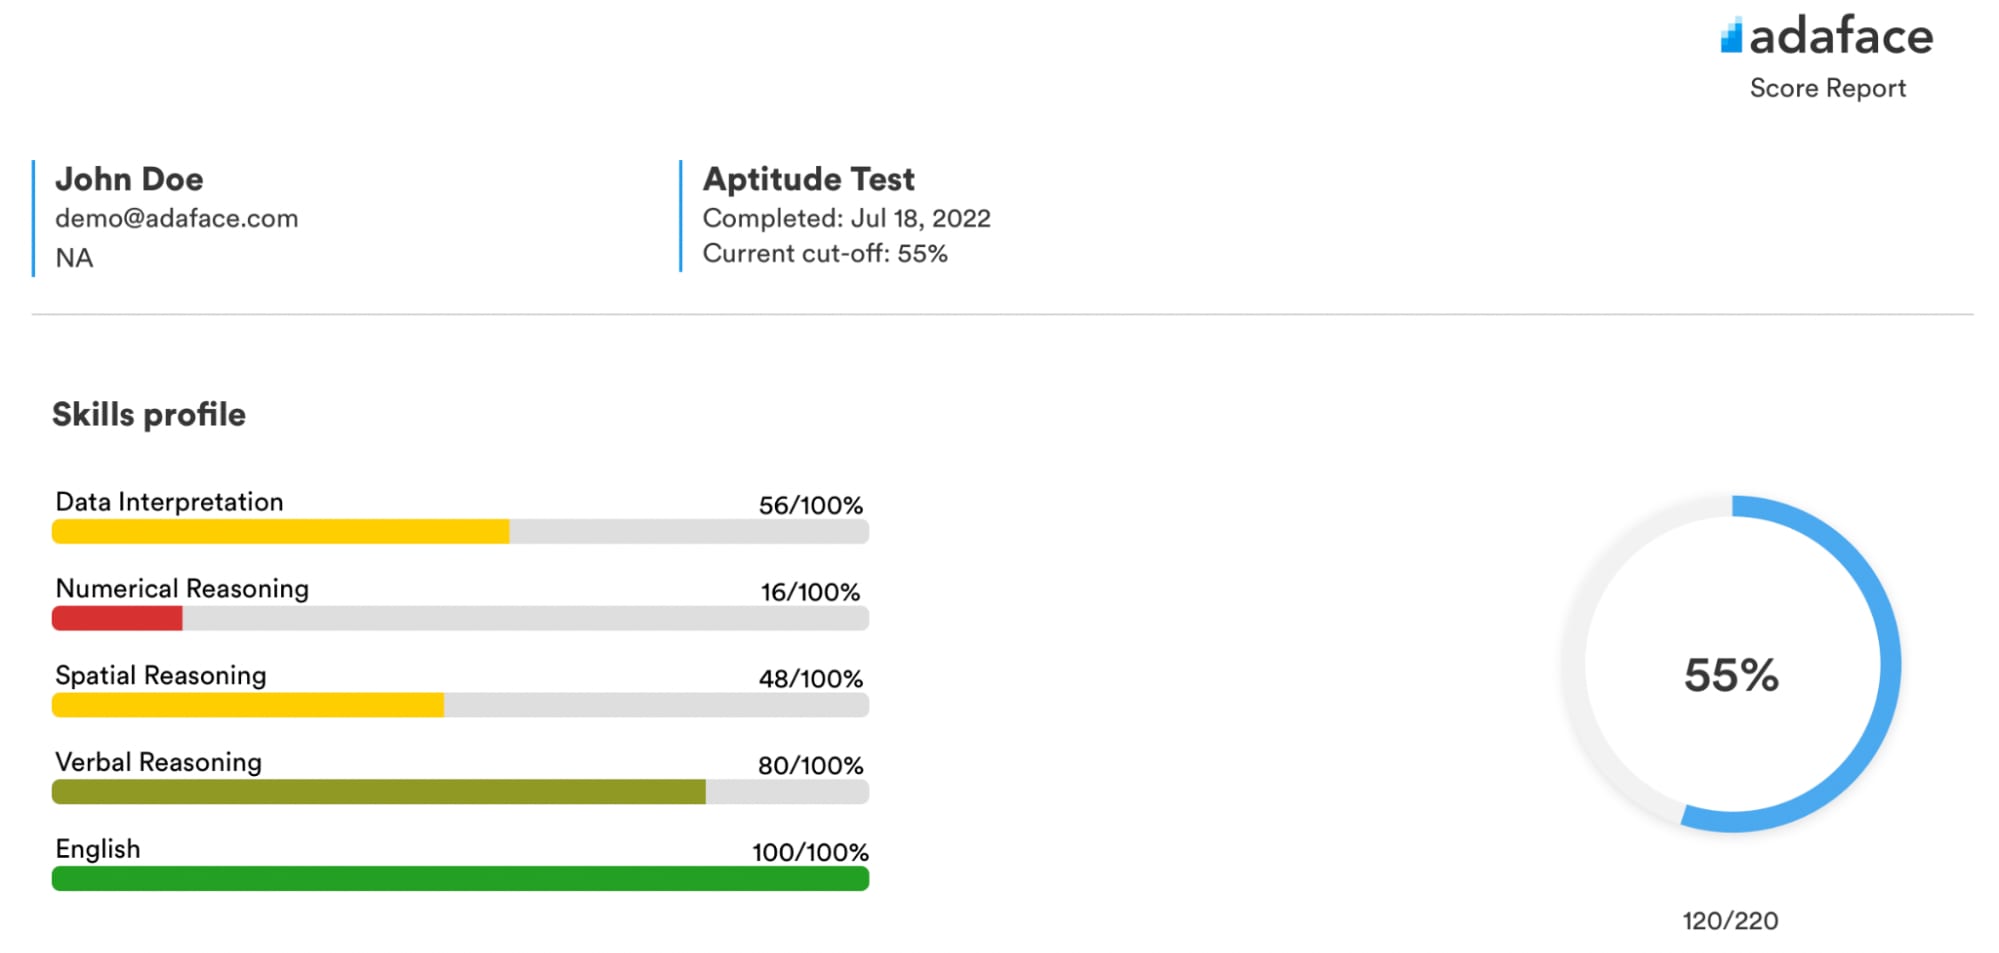
Example: Average score of candidates in a psychometric test to identify general performance trends.
b) Inferential Analysis
Draws conclusions and predictions about a population based on sample data.
- Hypothesis testing
- Confidence intervals
- Correlation & regression analysis
- ANOVA and chi-square tests
Example: Determining if training programs improve employee cognitive test scores significantly.
c) Predictive Analytics
Uses historical data to predict future outcomes.
- Regression modeling
- Machine learning algorithms
- Trend forecasting
- Risk analysis
Example: Predicting which candidates are likely to perform best in a specific job role based on assessment results.
d) Qualitative Data Analysis
Analyzes non-numerical data, such as responses to open-ended questions or behavioral observations.
- Thematic coding
- Sentiment analysis
- Pattern recognition in qualitative responses
Example: Identifying common behavioral traits among high-performing employees.
3. Data Interpretation
Data interpretation is the process of making sense of analysis results and translating numbers into actionable insights.
Key Steps
- Identify trends and patterns: Recognize consistent results or anomalies.
- Compare against benchmarks: Evaluate performance relative to industry or organizational standards.
- Draw conclusions: Determine implications for decisions, hiring, training, or operations.
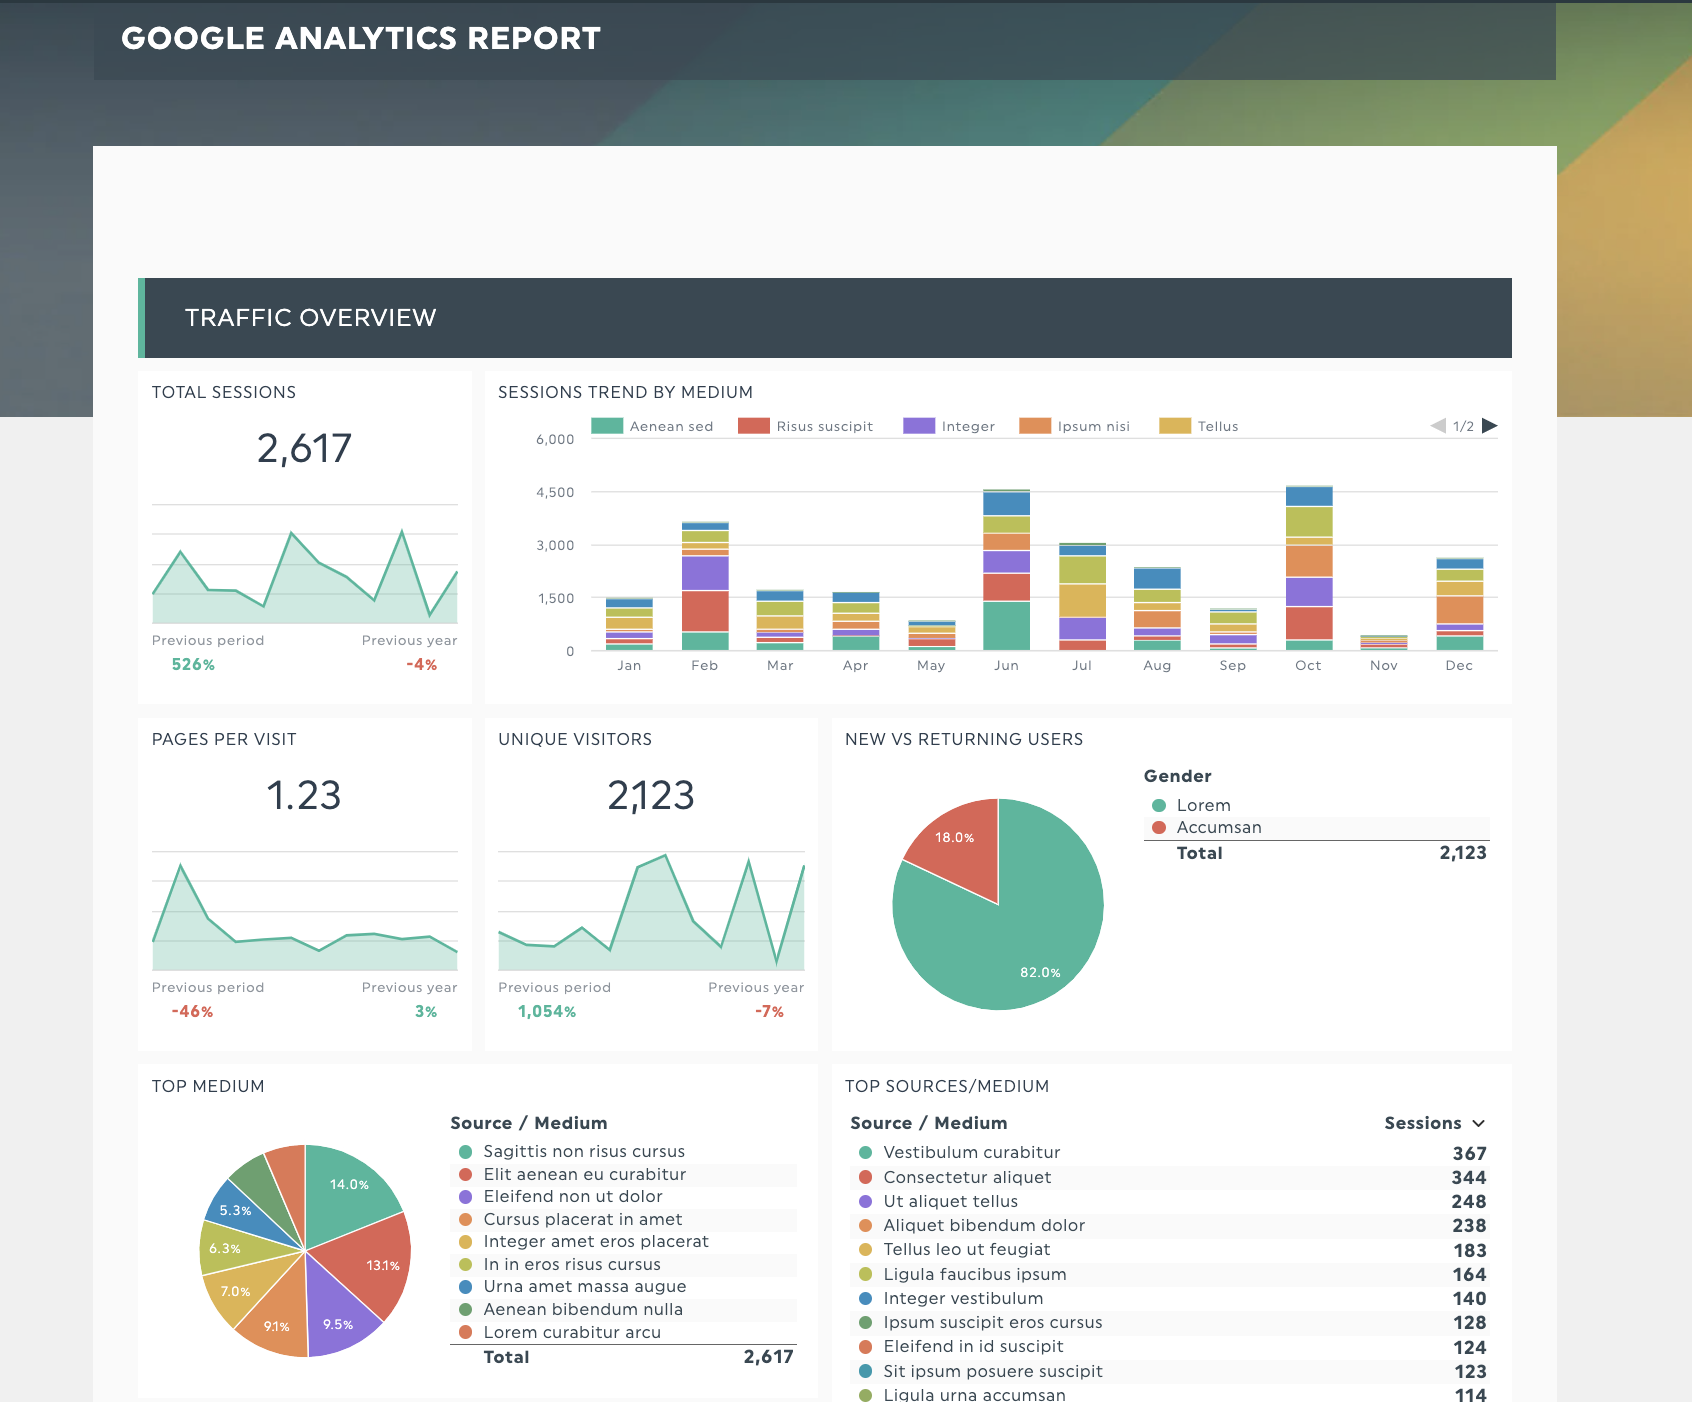
- Visualize insights: Use graphs, charts, dashboards to communicate findings effectively.
Example:
- Analysis shows candidates with high problem-solving scores also score high in critical thinking assessments.
- Interpretation: Recruit more candidates with strong problem-solving ability for roles requiring analytical thinking.
4. Tools & Methods in Data Analysis
Watson Quest leverages modern tools and methodologies to ensure efficient and accurate analysis:
- Statistical Software: SPSS, R, Python (pandas, numpy, matplotlib, seaborn)
- AI & Machine Learning: Predictive modeling, clustering, classification
- Business Intelligence Tools: Power BI, Tableau, Looker
- Psychometric Analysis Tools: Item Response Theory (IRT), factor analysis, reliability and validity checks
These tools help transform raw assessment data into actionable HR, operational, or strategic insights.
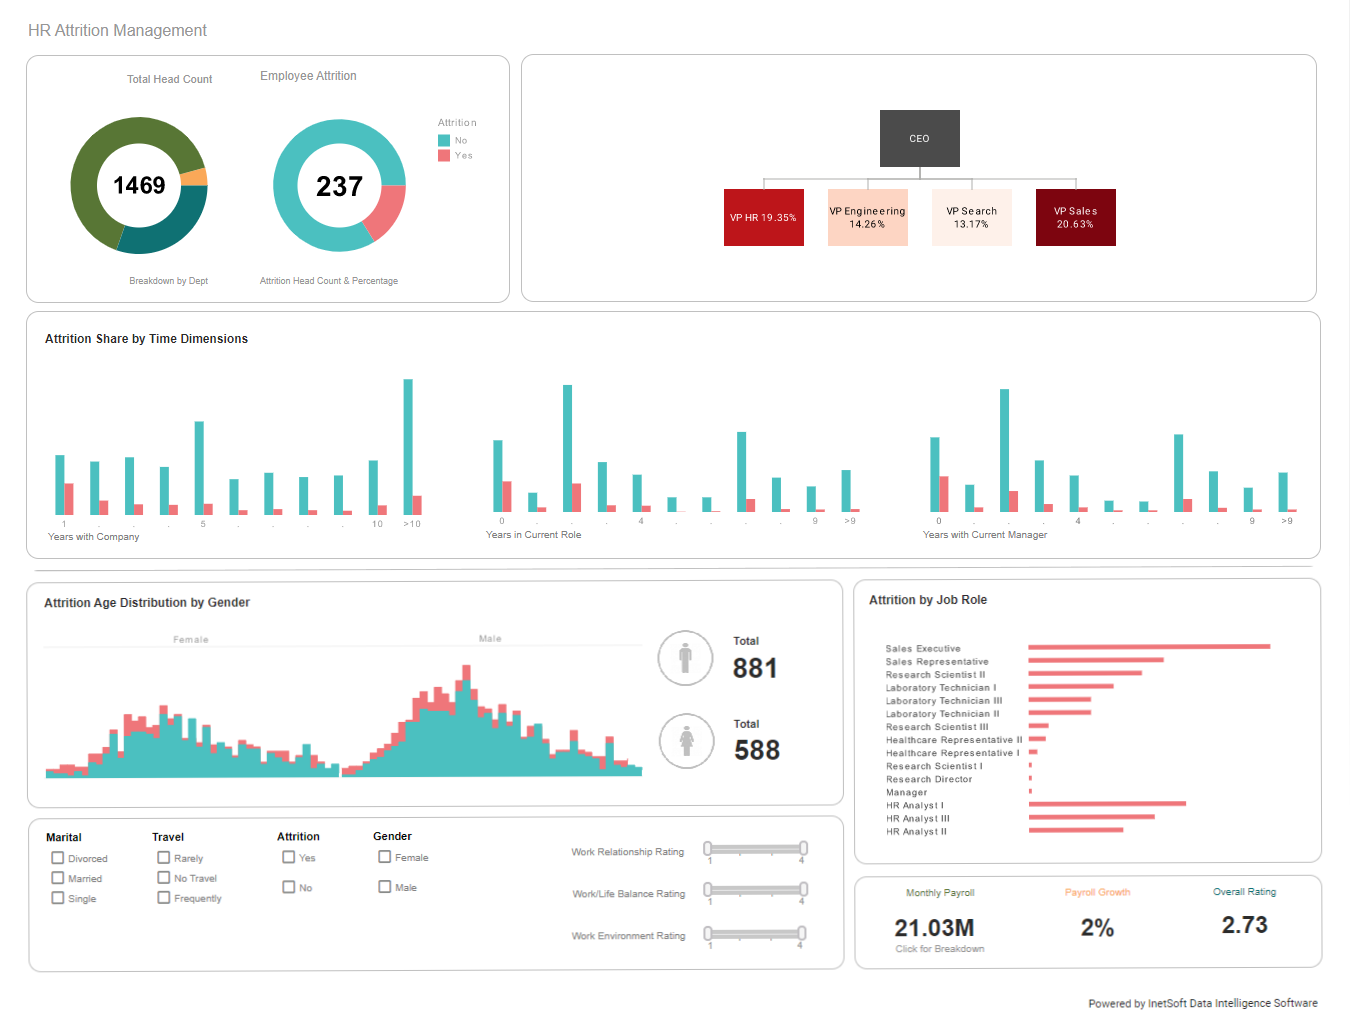
5. Applications of Data Analysis & Interpretation in HR and Industry
- Recruitment & Selection: Identify top talent based on assessment scores
- Performance Management: Track employee performance trends over time
- Training & Development: Measure training effectiveness and skill improvements
- Operational Efficiency: Optimize processes through workflow and KPI analysis
- Strategic Planning: Support management decisions using predictive insights
6. Reporting & Visualization

Watson Quest provides comprehensive reports with:
- Summary tables of scores and metrics
- Visual graphs and heatmaps for trends
- Benchmark comparisons against industry or role standards
- Predictive performance indicators
- Actionable recommendations for HR or management decisions
Reports are customizable for HR managers, executives, or academic institutions, making complex data easy to interpret and implement.
7. Benefits of Watson Quest Data Analysis & Interpretation
✔ Make evidence-based decisions for hiring and training
✔ Identify strengths and weaknesses in employees or candidates
✔ Predict future performance and potential accurately
✔ Reduce subjective bias in recruitment or evaluation
✔ Enhance operational and strategic efficiency
✔ Communicate insights effectively with visual dashboards and reports
Watson Quest – Turning Data into Actionable Insights
Through rigorous data analysis and interpretation, Watson Quest transforms raw information into actionable intelligence. Whether for HR psychometric testing, industry assessments, or organizational strategy, our system ensures you understand performance, predict outcomes, and make informed decisions.